Debugging Vulkan using RenderDoc
This article presents how to set up RenderDoc debugging for the Vulkan app. Our goal is to:
- Assign labels to Vulkan objects like
VkBuffersorVkImages, - Mark the graphic/compute passes in the
Event Browserwindow with readable names, - Debug GLSL shader code as easily as if it was run on the CPU.
To do so, we will first see how to load the app into RenderDoc. RenderDoc is one of the most popular debugging tools in the industry. You may encounter a few errors at this step. Together we will find a way to squash them. Then we will use Vulkan extensions to make debugging a breeze. Your app uses tons of textures, framebuffers, and different graphic/compute passes? Assign a unique label to make them easy to recognize. Finally, while all code executes on GPU, we will pretend it’s all on CPU. “Step into”, “Run to cursor”, local/global variables, stack trace - you name it, we will have it.
Using Vulkan extensions we can assign meaningful labels for passes and other objects. This makes it easier to traverse the frame events. We can also do shader debugging as if the code runs on the CPU. If you use Visual Studio debugger, even the keybindings are similar.
Loading the app into RenderDoc
The first step is to load the app into RenderDoc. Usually, Executable Path, Working Directory and Command-line Arguments in Launch Application should be enough. Click Launch. When the app is running, press F12 to capture the current frame. After closing the app try to open the capture. If everything is ok you can skip the next section. From my experience, RenderDoc is more sensitive to errors than the VK_LAYER_KHRONOS_validation.
There are a few other ways to capture the frame, you can read more in RenderDocs’ “How do I capture a frame?”.
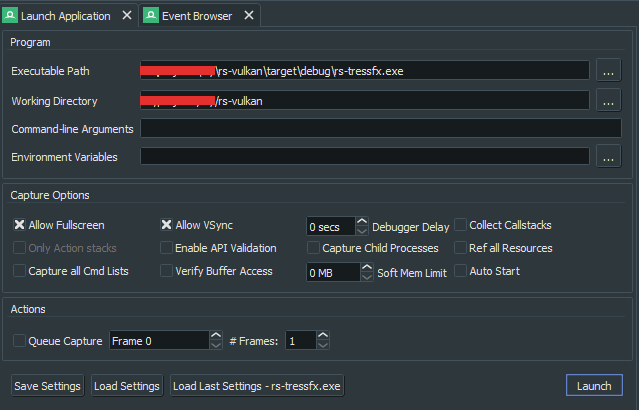
In RenderDoc there are many launch options available. Yet for me, Executable Path and Working Directory were the only ones required.
Bug example when loading the capture
For most of the development of Rust Vulkan TressFX I was not able to load the capture. I assumed that RenderDoc had some problem with Vulkan on my PC and ignored the problem. I randomly received VK_ERROR_DEVICE_LOST during vkQueueSubmit. Yet sometimes it worked fine. At the same time, I saw the following errors in RenderDoc’s Errors and Warnings window:
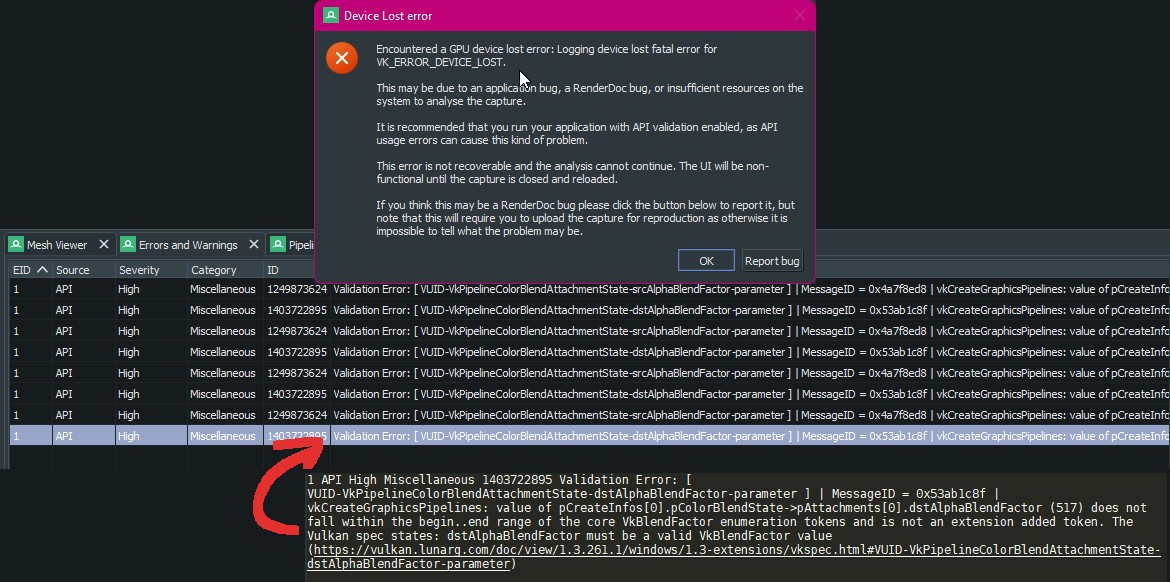
Example VK_ERROR_DEVICE_LOST error dialog. Sometimes, the Errors and Warnings window will contain the error log.
Let’s look at my code:
pub fn ps_color_blend_override(color_attachment_count: usize, ...) -> vk::PipelineColorBlendStateCreateInfo {let blend_state = vk::PipelineColorBlendAttachmentState::builder()....build();let mut attachments = Vec::<vk::PipelineColorBlendAttachmentState>::with_capacity(attachment_count);for _i in 0..attachment_count {attachments.push(blend_state);}vk::PipelineColorBlendStateCreateInfo::builder().attachments(&attachments) // reference!.build()}
The function ps_color_blend_override will return VkPipelineColorBlendStateCreateInfo. Readers more familiar with Vulkan will recognise this object as part of VkGraphicsPipelineCreateInfo. In the code:
- We create
Vec<vk::PipelineColorBlendAttachmentState>, - Set it as the reference in the
attachmentsfield, - Return
VkPipelineColorBlendStateCreateInfo.
As you might notice, Vec<vk::PipelineColorBlendAttachmentState> goes out of scope. I’ve fixed this error in 8927ca2. In the screenshot above, in the Errors and Warnings window, RenderDoc does indeed complain about dstAlphaBlenderFactor.
Error dialog for VK_ERROR_DEVICE_LOST prevents switching to the Errors and Warnings window. If this happens, click Report bug and then check the content of the zip that reproduces the error. The file called error.log inside the archive will have the full log. Look for lines containing ‘Validation Error’.
This (a bit long) example demonstrates that sometimes the errors can be simple. Unfortunately, VK_ERROR_DEVICE_LOST as an error code is not particularly enlightening. Especially if it happens in vkQueueSubmit.
Apart from RenderDocs’ Errors and Warnings window, you could try Vulkan’s validation layers. All Vulkan SDKs contain the vkconfig executable. It allows you to switch validation layers on/off independently from the source code. If this fails, either comment out parts of the app or try older commits. NVIDIA Nsight Aftermath SDK is a tool that could be helpful (I’ve never tried it). Unfortunately, Radeon™ GPU Detective seems to be DirectX 12 only. Hardcore Vulkan debugging – Digging deep on Linux + AMDGPU by Hans-Kristian Arntzen has more tips. E.g. using VK_AMD_buffer_marker or VK_NV_device_diagnostic_checkpoints to check markers before the last executed command.
Adding labels to the Vulkan resources
In this section, we will see how to add human-readable labels to different Vulkan objects. It will make it easier to discern API calls and used resources in RenderDoc.
Adding VK_EXT_debug_utils
VK_EXT_debug_utils is the first device extension every Vulkan programmer ever used:
// uses ash::extensions::ext::debug_utils to simplify codelet extension_names = [..., DebugUtils::name().as_ptr()];let create_info = vk::InstanceCreateInfo::builder().enabled_extension_names(&extension_names)....build();let instance: Instance = entry.create_instance(&create_info, None).expect("Instance creation error");// init message callbacklet debug_utils_loader = DebugUtils::new(&entry, &instance);let debug_call_back = debug_utils_loader.create_debug_utils_messenger(&debug_info, None).unwrap();
Today let’s explore other functions provided by this extension:
Assigning labels to buffers and images
VK_EXT_debug_utils allows to assign a label to objects of type VkObjectType. This includes every object type you might want.
unsafe fn set_object_debug_label(debug_utils: &DebugUtils,device: &vk::Device,// e.g. vk::ObjectType::IMAGE or vk::ObjectType::BUFFER or vk::ObjectType::RENDER_PASS etc.object_type: ObjectType,// raw Vulkan handleobject_handle: u64,name: &str,) {let name_c = CString::new(name).unwrap();let name_info = vk::DebugUtilsObjectNameInfoEXT::builder().object_type(object_type).object_handle(object_handle).object_name(&name_c).build();debug_utils.set_debug_utils_object_name(*device, &name_info).expect(&format!("Could not set name '{}'", name));}// usage:let index_buffer_info = vk::BufferCreateInfo { ... };let index_buffer = device.create_buffer(&index_buffer_info, None).unwrap(); // vkCreateBufferset_object_debug_label(&debug_utils, &device.handle(), ObjectType::BUFFER, index_buffer, "MyIndexBuffer");
All we need to do is fill VkDebugUtilsObjectNameInfoEXT with:
VkObjectType,- Vulkan resource handle,
- name string.
Provide it to vkSetDebugUtilsObjectNameEXT and we are done.
Assigning labels to passes
Even if we add labels to VkRenderPass object, they will not show up in the Event Browser window. The label will be only visible on all objects that reference it e.g. VkPipeline. You may notice that it’s not even what we want. We want to ‘group’ Vulkan commands between the start and end events. With vkCmdBeginDebugUtilsLabelEXT and vkCmdEndDebugUtilsLabelEXT we could have the following example sequence of commands:
vkCmdBeginDebugUtilsLabelEXT(...); // start regionvkCmdBeginRenderPass(...);vkCmdBindDescriptorSets(...);vkCmdBindPipeline(...);vkCmdBindVertexBuffers(...);vkCmdDrawIndexed(...);vkCmdEndRenderPass(...);vkCmdEndDebugUtilsLabelEXT(...); // end region
Translating this into Rust:
pub unsafe fn begin_cmd_buffer_debug_label(debug_utils: &DebugUtils,command_buffer: vk::CommandBuffer,name: &str,) {let name_c = CString::new(name).unwrap();let marker = vk::DebugUtilsLabelEXT::builder().label_name(&name_c).build();debug_utils.cmd_begin_debug_utils_label(command_buffer, &marker);}pub unsafe fn end_cmd_buffer_debug_label(debug_utils: &DebugUtils,command_buffer: vk::CommandBuffer,) {debug_utils.cmd_end_debug_utils_label(command_buffer);}// usage:begin_cmd_buffer_debug_label(&debug_utils, command_buffer, "MyRenderTrianglePass");... // cmd_begin_render_pass() / cmd_draw_*() / cmd_end_render_pass() etc.end_cmd_buffer_debug_label(&debug_utils, command_buffer);
This is enough to group the commands inside RenderDoc’s Event Browser window. There are a few edge cases that you might consider:
- There are other commands than draws or compute dispatches. In Rust-Vulkan-TressFX I implemented Order-independent transparency using Per-pixel Linked Lists. First, it clears the list heads storage image with
vkCmdClearColorImageand resets the atomic counter withvkCmdFillBuffer. Only aftervkCmdPipelineBarrierwe can runvkCmdDraw*. - Certain passes might contain subpasses or might execute more than once. Blur passes are often split into separate horizontal and vertical draws. This may or may not mean 2 calls to
vkCmdBeginRenderPass. It’s up to you how you want to structure this in RenderDoc.
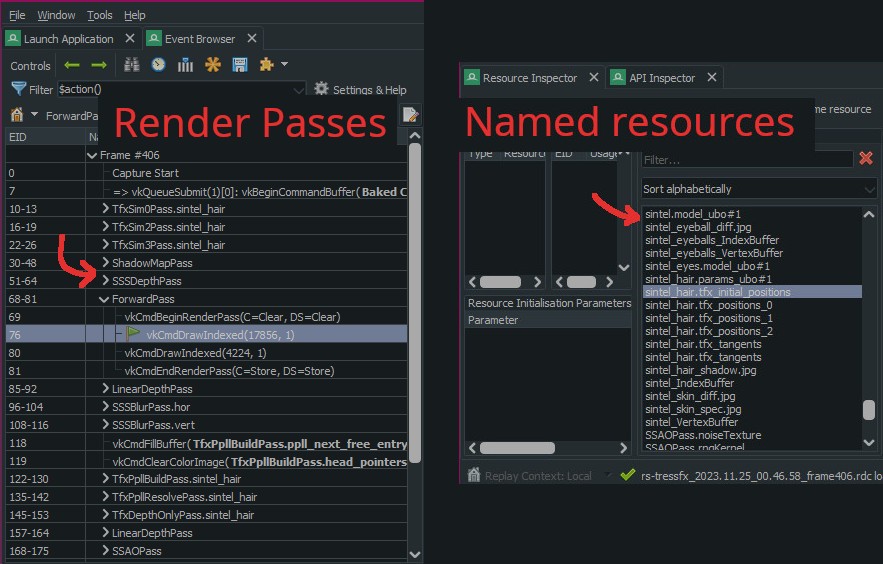
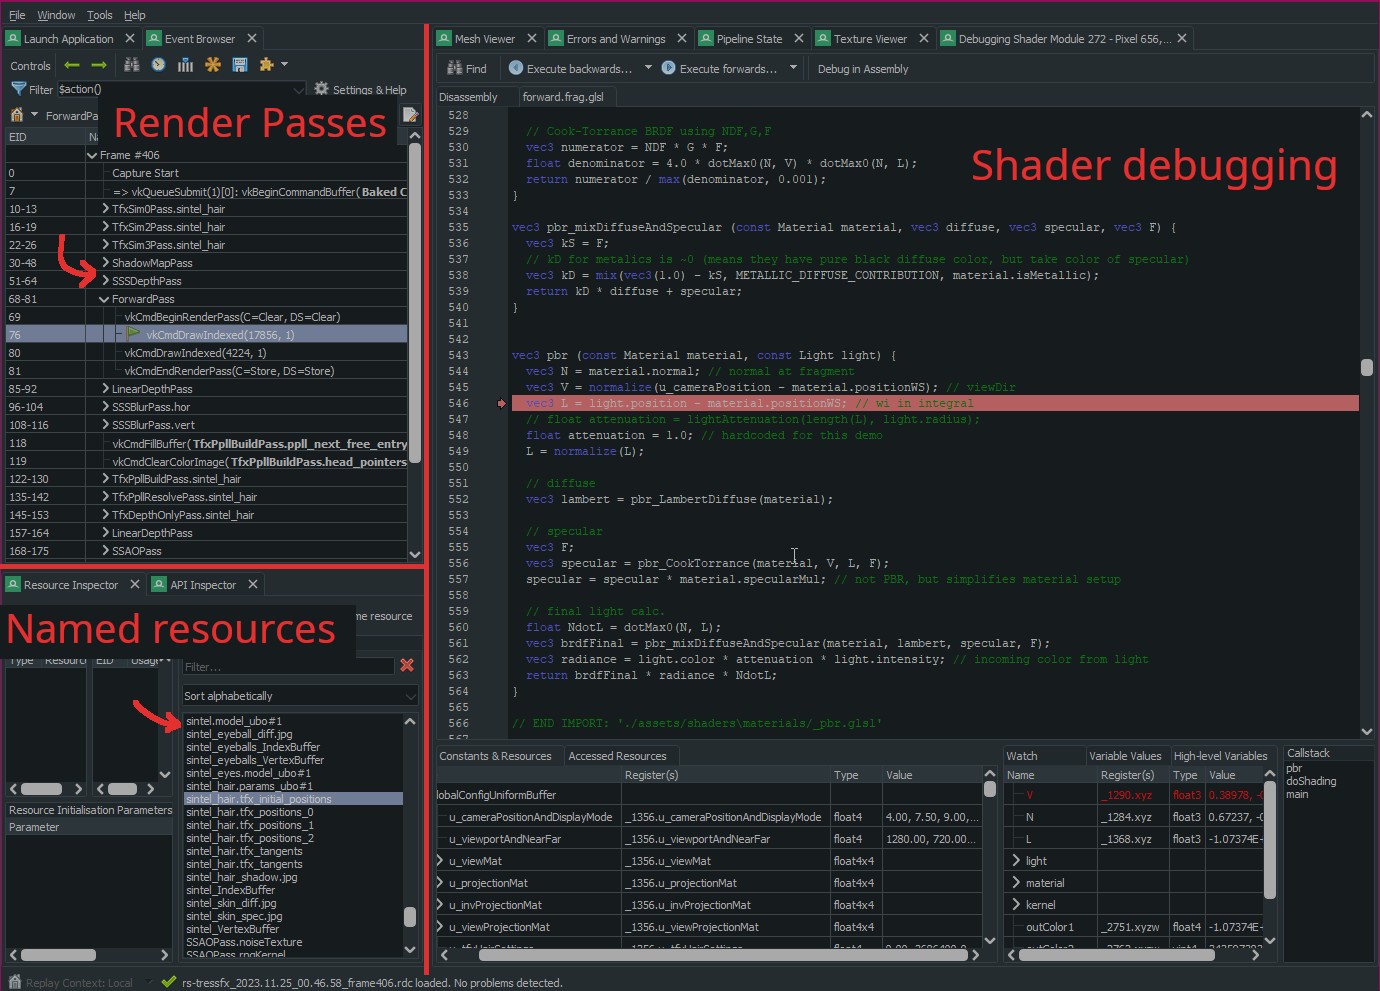
Some of the passes and resources from Rust Vulkan TressFX.
Debugging GLSL shaders in RenderDoc
The standard way to use shaders in Vulkan is to compile GLSL file into SPIR-V using e.g. glslc.exe -O -fshader-stage=frag "src/shaders/texture.frag.glsl" -o "src/shaders-compiled/texture.frag.spv". Then we read the .spv file from C++/Rust and set the pCode pointer in VkShaderModuleCreateInfo. The .spv file is binary. This means that RenderDoc will not be able to reconstruct the original .glsl text. Instead, we can use VK_KHR_shader_non_semantic_info device extension to add special metadata. It embeds raw .glsl text into a .spv file.
Embedding GLSL text into .spv file
Use glslangValidator to insert .glsl text into a .spv file. It comes preinstalled with Vulkan SDK:
glslangValidator.exe -e main -gVS -V -o "src/shaders-compiled/texture.frag.spv" "src/shaders/texture.frag.glsl"
Let’s explain the flags (I’ve also added --help text if you want more ‘formal’ definitions):
-e main(“specify ‘name’ as the entry-point function name”). Name of the main function fromsrc/shaders/texture.frag.glsl.-gVS(“generate nonsemantic shader debug information with source”). Add metadata into.spv- this is exactly what we want.-V(“create SPIR-V binary, under Vulkan semantics”). It informs the compiler that we are using GLSL (compatible with GL_KHR_vulkan_glsl) as opposed to HLSL etc.-o "src/shaders-compiled/texture.frag.spv". Output.spvfile.src/shaders/texture.frag.glsl. Input.glslfile.
This command replaces glslc.exe. If you then look into the final .spv file, you will see something like:
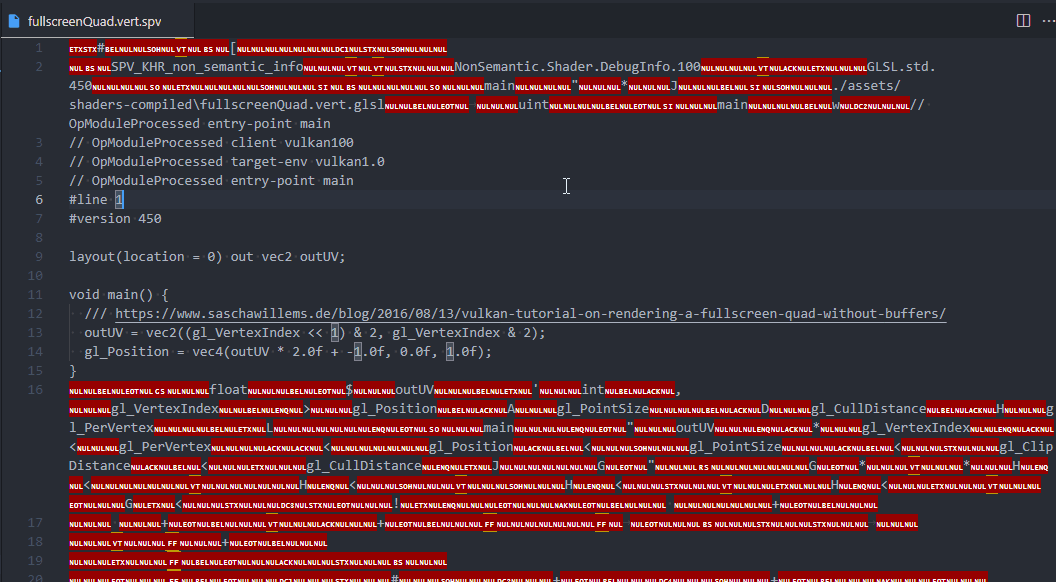
Content of .spv file with embedded GLSL. Besides the raw text, it also contains the original file path, entry point name as well as some other values.
As you can see, the binary .spv file indeed contains our .glsl text. Keep in mind that this will increase the size of the .spv.
Enabling the VK_KHR_shader_non_semantic_info extension
If you run the app now on Vulkan 1.3+, it should work without a problem. On previous Vulkan versions you will receive the following error:
The SPIR-V Extension (SPV_KHR_non_semantic_info) was declared, but one of the following requirements is required (VK_VERSION_1_3 OR VK_KHR_shader_non_semantic_info). The Vulkan spec states: If pCode is a pointer to SPIR-V code, and pCode declares any of the SPIR-V extensions listed in the SPIR-V Environment appendix, one of the corresponding requirements must be satisfied (https://vulkan.lunarg.com/doc/view/1.3.261.1/windows/1.3-extensions/vkspec.html#VUID-VkShaderModuleCreateInfo-pCode-08742)
To fix it, you need to enable VK_KHR_shader_non_semantic_info device extension. Here is the Rust ash code:
let ext_shader_non_semantic_info = CString::new("VK_KHR_shader_non_semantic_info").unwrap();let device_extension_names_raw = [ext_shader_non_semantic_info.as_ptr(),...];let device_create_info = vk::DeviceCreateInfo::builder().enabled_extension_names(&device_extension_names_raw)....build();let device = instance // vkCreateDevice.create_device(physical_device, &device_create_info, None).unwrap();
Debugging shader in RenderDoc
Depending on the type of the shader, there are different ways to start the debugging session:
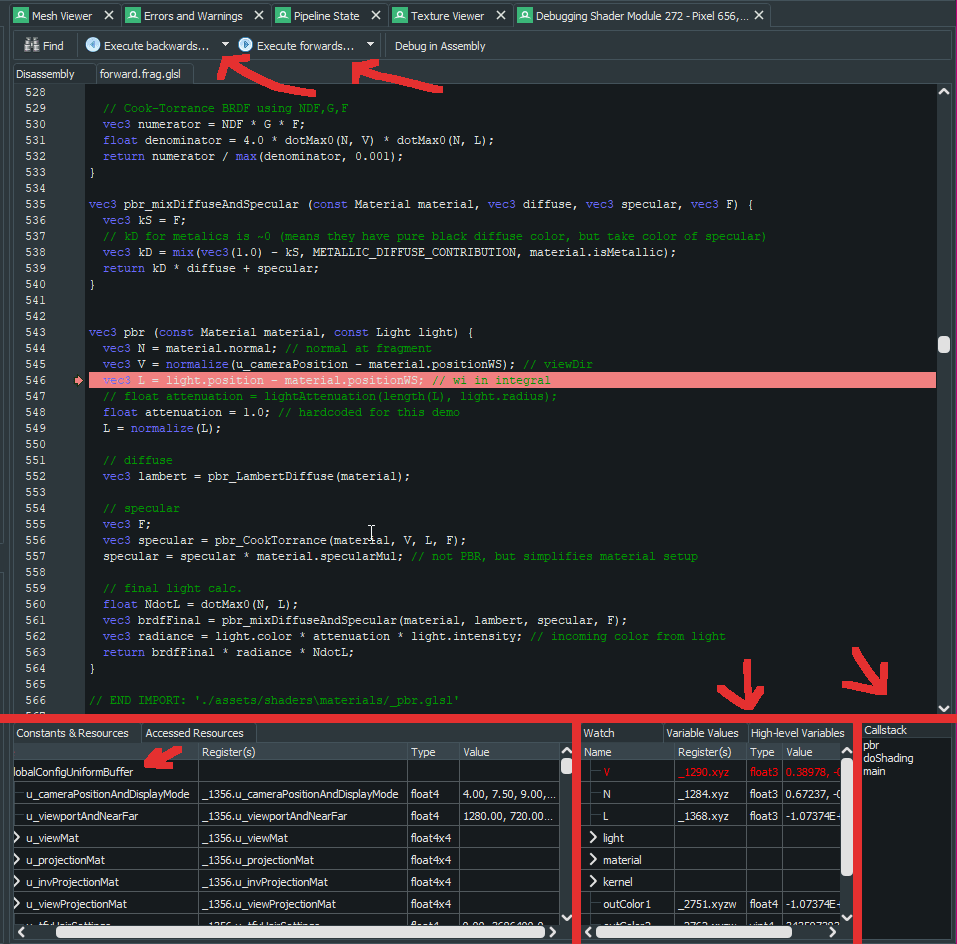
Debugging fragment shader. F10 moves a single step forward while shift-F10 moves 1 step backward. You can inspect uniform buffers content, local variables and add watches. It even has the call stack.
Summary
Vulkan is quite complex. One way to fight this complexity is with better debugging tools. The API deals with opaque GPU state. It’s complicated for programmers that are used to the transparency of the CPU. In this article, we’ve enhanced RenderDoc debug experience so that:
- we can identify every object by name,
- we can search the events that happened during the frame,
- we can debug GPU code as if it was run on the CPU.